


Bust Common Myths About Java Programming
Loading
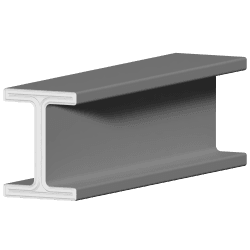
Tensile Strength and Capacity Control of the W-Shape Sections According to AISC 360-16
Loading
Concrete Cylinder Strength Vs Cube Strength
Loading
Earthquake Design Action Calculation
EM Wave Propagation Calculator
İKSA YAPILARI PROJELENDİRME HİZMET BEDELİ (2024)
section properties with units
GEOTEKNİK RAPOR (EK-B) ASGARİ HİZMET BEDELİ (2024)
Forward Kinematics of Robotic Arm with 6 Degrees of Freedom
ZEMİN İYİLEŞTİRME/DERİN TEMEL PROJELENDİRME ASGARİ HİZMET BEDELİ (2024)
İKSA YAPILARI PROJELENDİRME HİZMET BEDELİ (2023)
Loading
Dezi et. al (2010)
🤾
Projectile motion
We are introducing our Reinforced Concrete Column P-M Diagram Calculator. This tool provides structural engineers and designers with a straightforward solution to assess the strength properties of reinforced concrete columns, streamlining the design process with efficiency and compliance in mind.
This calculator is in imperial [IMP] system. Currently columns can only be of a rectangular cross-section.
Calculation
Inputs
Geometry
width_1
:20.00 in
width_2
:15.00 in
clear_cover
:1.50 in
Materials
f'c
:4,000.00 psi
fy
:60,000.00 psi
Longitudinal Reinforcement
N1_bars
:4
bar1_diameter
:8.00
N2_bars
:4
bar2_diameter
:8.00
corner_bar_diameter
:8.00
Shear Reinforcement
Stirrup_diameter
:3.00Can’t display the image because of an internal error. Our team is looking at the issue.
Output
Can’t display the image because of an internal error. Our team is looking at the issue.
Explanation
The above calculation is according to the following theory:
Basic Premises
- Internal forces within a structure are in equilibrium with external forces acting upon it.
- The unit deformation of an embedded reinforcement bar is consistent with that of the surrounding concrete.
- Plan sections remain plain even after the application of loads.
- It is assumed that concrete exhibits negligible resistance to tensile loads.
Axial Load Strength
Axial Compression Strength
At a low load application rate, the accepted compressive strength for the concrete is 0.85 times the specified compressive strength (
).The ultimate axial strength of the element is attained when the concrete undergoes crushing failure, and the reinforcement steel yields:
Where:
- = (Compressive Strength of Concrete): This represents the compressive strength of concrete. It measures the maximum compressive stress that concrete can withstand under axial loads.
- = (Gross Sectional Area): This refers to the total cross-sectional area of a structural element, such as a column or a beam. It includes the area of both the concrete and any reinforcing steel.
- = (Steel Yield Stress): This is the yield strength of the reinforcing steel. It indicates the stress at which the steel exhibits significant plastic deformation.
- = (Total Longitudinal Reinforcement Area): This represents the total cross-sectional area of a concrete element's longitudinal (primary) reinforcement. It is the sum of the cross-sectional areas of all the individual longitudinal bars.
Axial Tensile Strength
The concrete is fully fissured when the ultimate axial tensile strength is reached, rendering its contribution null. Therefore, the ultimate strength is attained when the reinforcement reaches its yield stress.
Flexo-Compression
P-M Diagram
For the given section
, axially loaded with
and an eccentricity
:
The distribution of strains in a section (a-a) for an immediate failure state assumes that plain sections remain plain and vary linearly with the distance 'c' from the neutral axis.
By ensuring the compatibility of strains, the strains experienced by the reinforcement at any location are identical to those exhibited by the surrounding concrete.
Where:
- = (Ultimate Strain of Concrete): refers to the ultimate strain or deformation that concrete can undergo before failure. It represents the maximum deformation the concrete material can experience under load.
- , = (Reinforcement Bar Strain): denotes the strain experienced by the reinforcement bars.
Internal Forces Equilibrium
The summation of forces adheres to the internal axial force equilibrium, where
represents the ultimate axial strength force.
Stands for the concrete compression force given by the Whitney equivalent rectangular stress distribution and:
The summation of internal flexural moments and forces originating from the centre of the span must be equal and opposite to the internal force
.:
Compatibility of strains
Geometrically:
Hook's law:
Where:
- = Modulus of elasticity of the reinforcing steel.
Balanced Failure
In reinforced concrete columns, the concept of "balanced failure in flexo-compression" refers to a condition where the concrete in compression and the tensile reinforcement reach their limit states simultaneously. In this balanced state, the column is designed to maximize the utilization of both materials, ensuring an efficient use of concrete and steel.
P-M Interaction Diagram
Given the above equation, the P-M interaction diagram is crafted by varying the "c" values within the range of (0, h).
The Diagram shows all the possible combinations of P-M valid for the concrete column cross-section.
Code Checks
COMING SOON
Related Resources
- Importance of pm interaction curve in column-design
- Reinforced Concrete Structures - Park & Paulay
- Seismic Design of Reinforced Concrete Buildings - Jack Moehle